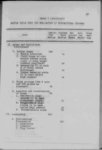
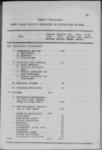
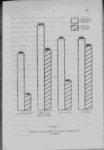
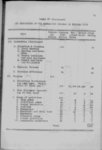
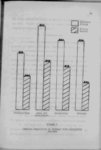
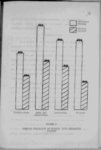
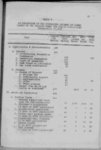
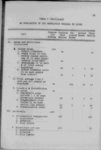
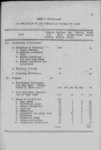
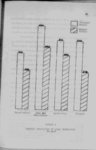
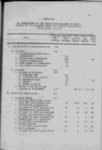
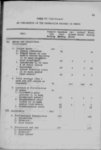
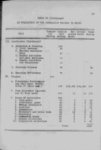
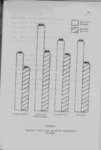
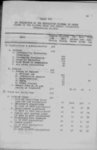
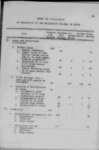
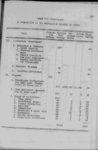
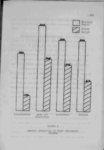
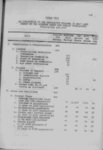
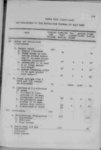
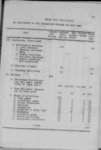
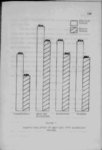
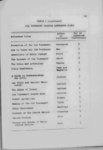
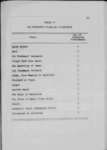
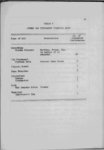
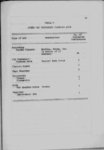
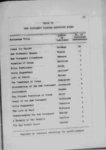
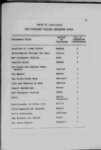
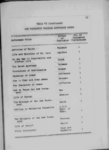
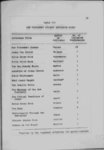
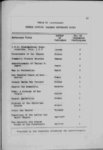
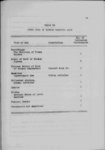
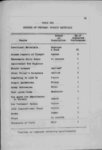
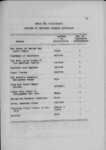
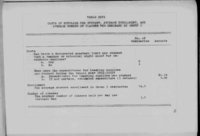
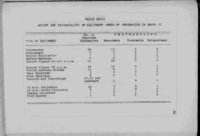
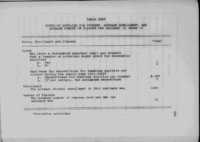
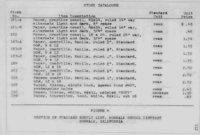
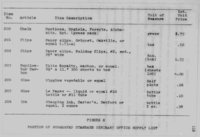
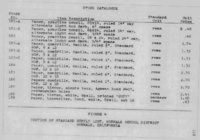
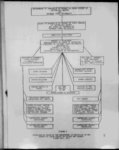
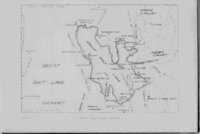
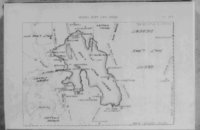
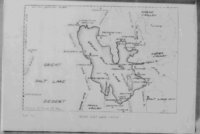
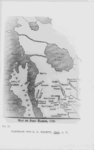
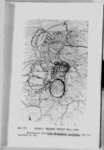
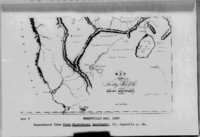
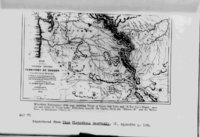
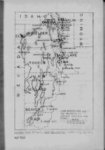
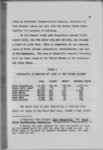
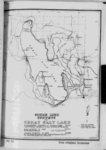
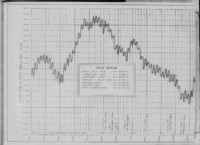
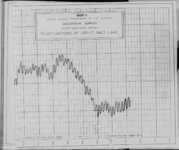
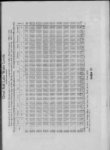
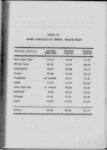
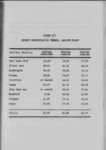
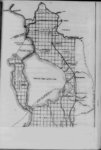
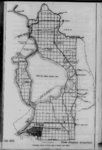
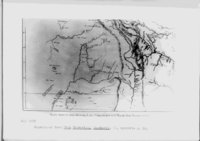
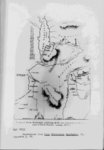
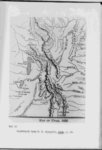
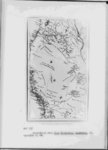
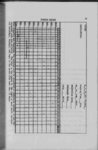
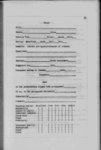
| Show 270 From 1896 until 1906 years confirms this relationship there was not a single year when the precipitation in northwestern Utah was normal In fact the nearest to a normal year was in 1899 when the rainfall was 92 $ It fell as low as 80$ in 1904 Compare these figures with graph "Fluctuations of the Great Salt Lake" following page 263 Then followed a seven year period when the rainfall was far above average reaching 122$ in 1909 This had a effect on lake oscillation A period of normal precipitation continued until 1920 when there began a ten year cycle of above normal During this time the high period of marked 1923 occurred when heavy waves endangered the right-of-w- ay on the Lucin Cut-o- ff In 1931 began another low period which fell to 82$ in 1935 From 1935 to 1940 precipitation fill was about normal However bringing the lake level and November 1940 the year 1939 reached only 69$ down Following to its this all-ti- me low point low in October the lake has gradual rise During 1946 the highest point recorded was "plus 3" on the Boat Harbor gauge the first "plus" ® 1934 This was an impressive rise since recorded reading over the "minus 32" of the low period of 1940 The latest shown a States ’leather Bureau "Climatic Summary of the United States Section 20—Western Utah" "Average PrePeriod 1898-19cipitation in Northvestern Utah for Inclusive" 13 See Table II "Great Salt Lake Water Levels" p 271 12 United 35-Y- ear 32 |