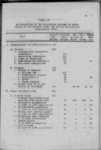
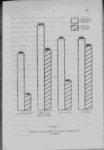
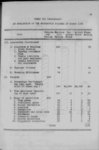
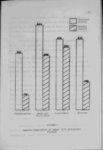
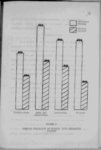
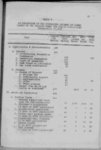
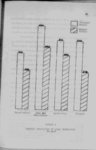
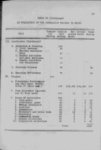
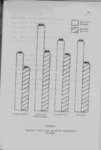
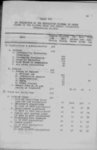
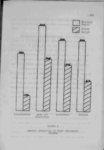
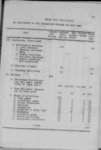
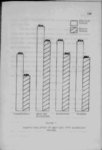
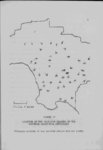
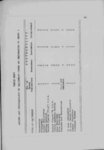
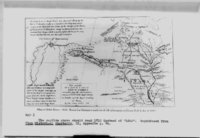
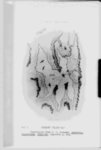
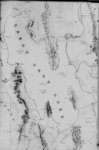
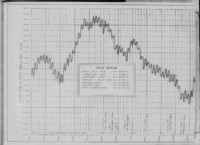
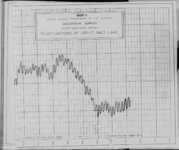
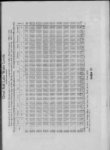
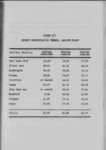
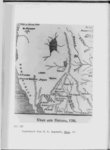
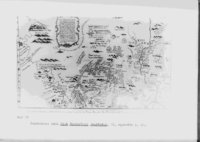
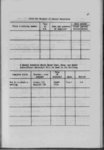
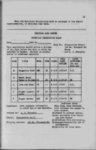
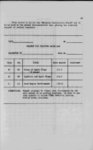
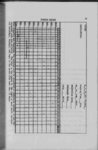
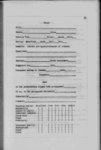
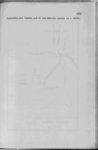
| Show 263 1925 and operated for several years Figures available for several months in 1928 (an average year) show the amount of evaporation in inches: April 681 May 1119 June 1174 July 1322 August 1296 September 992 October 492 November 214 total for the eight months 729 inches2 With average precipitation at Corinne for the years 1898-19standing at only 1363 inches there would have to be a great amount- of water running into the lake by means of rivers to maintain the lake level An authentic graph showing the annual high and low water levels of the lake since 1850 has been prepared by the United States Geological Survey® However since the first official gauging station was not established until 1875 the i 32 - i i i 3 I first part of this graph is based on only partially reliable information Nevertheless since many boatmen had been on the lake and numerous passages had been made to the various i islands information concerning the lake levels during these 5) twenty-fiv- e may be considered quite accurate years (1850-187- Fremont made the if f ? I a i' s first recorded lake soundings when he visited Fremont Island in September 1843 However these were very incomplete actual locations indefinite and therefore of practically no value Two years later however when the b Information obtained from the United States Weather Bureau files Salt Lake City Utah 3 See Graph I following this page 2 i t I - I P t ! I I i j ? J - I |