| OCR Text |
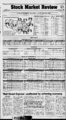
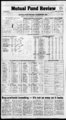
Show D Sunday, March 10, 1996 The Daily Herald MUTUAL" FUND REVIEW: I upper! By The Associated Press and Lipper Analytical Services Inc.' TECH FUNDS RETREAT IN QUARTER By A FUNDS BY OBJECTIVE GROUP BEST-PERFORMI- Chet Currier, AP Business Whiter CA x CAPITAL APPRECIATION FUNDS Return Funo Name tier starring for most of 1995, science and technology funds a conservative image. Period "Investors started to move out of Quarter tech in a major way." said Michael 12 Months stumbled in the fourth quarter as the U.S. stock mutual fund industry 5 Years 25 05 78.57 349.79 Bruce Fund AlgerCapital Apprec PBHG Growth Fund Lipper, president of Lipper Analytical 671 .1 10 Years PBHG Growth Fund Services Inc. 15 Years Oppenhmr Quest Value;A 1,052.12 "Money is flowing into G Growth Funds Return Period Fund Name large stocks - it's concerned." 1 completed a prosperous year. The setback took the tech funds out of contention for group of the International funds year, leaving health and biotechnology funds and in Quarter Insightful Inv Growth 12 Months tDminion:lnsight Growth general, and Latin American funds in particular, also fared 5 Years 10 Years poorly in the fourth quarter. 1 5 Years financial services funds at the top of the list. Since they racked up big gains in 1993, foreign funds have consistently trailed their U.S. stock counterparts. d funds lost ground, Equity income, growth and income and S&P 500 index funds had a strong fourth quarterreflecting a revived enthusiasm among investors for blue chips and similar issues with Gold-oriente- finishing a sluggish year amid worldw ide signs of abating inflation. st QUARTER 1 996 1 14.08 64.60 321.96 664.80 Fidelity Destiny II Fidelity Magellan Fund S 1 ,638.85 Putnam New Oppty;A SG SMALL COMPANY GROWTH FUNDS Period Fund Name Return 15.53 Sm Barney Spec Eqty;A 12 Months Govett:SmallerCo;A Twen Century:Giftrust 5 Years Quarter 10 Years 15 Years 68.99 350.09 767.62 694.65 Twen Century:Giftrust Acorn Fund FUNDS BY INCOME FUNDS Gl GROWTH Fund Name Period Quarter 1 Fund y 12.11 2 Months Baron Growth & Income 52.54 Oppenheimer Main:l&G;A 283.07 454.98 Fidelity Growth & Income 1033.34 Mutual:Qualif)ed 5 Years 10 Years 15 Years EQUITY INCOME FUNDS Fund Name El Return Pefko Quarter 12 Morrths Kemper-Dreman:- 5 Years Kernper-Dreman:- Ret;A Ret;A Flag Inv Tphone lnc;A United: Income; A 10 Years 15 Years IF 11.05 46.86 180.77 Ret;A Kemper-Dreman:- 328.61 927.64 x INTERNATIONAL FUNDS Return 7.70 30.09 150.37 450.82 638.63 Quarter GAM:lntemarjonal;A 12 Months GAM:lntematjonal;A 5 Years 10 Years 1 5 Years GAM:lntematjorial;A GAM:lntemational;A United IntJ Growth Fidelity Puritan 13785.7 12828.8 15203.6' Vanguard lndes:500 Port 11131.7 10077.0 9483.5 9348.7 8782.7 Janus Fund II Fidelity Equity-ln- c Eurooacific Growth Vanguard Windsor II Fidelity Equity-lnc. 38.88 10.62 23.86 6.57 30.59 10.44 16.49 5.33 29.65 7.94 12474.1 Vanguard Windsor 1 2054.5 Income Fund Of America Twentieth Century :Ultra Inv 11 790.2 1 1 566.6 Fidelity Contraf und 11548.4 Fidelity Growth & Income 7.82 6.83 5.22 11.25 10.22 7.56 1 97.27 321 82 633.10 Return Pax World Fund 12 Months Irrvesco Mutr.Balarced 5 Years Evergreen FoundarjoniY 10 Years State Farm Balanced 15Years CGM TrMutual Fund 36.46 142.79 28027 716.85 912 Quarter 70.94 21424 NA None 15 Years GLOBAL FLEXIBLE PORTFOLIO FUNDS Return Fund Name Period 5.70 12 Months Bnnson Global Putnam Asst:Growth:A 5 Years Memll Glbl AlkxA 111.93 10 Years USAA Cornerstone Strat 230.02 15 Years None Quarter 25.84 NA x INCOME FUNDS Fund Name Period I x FLEXIBLE PORTFOLIO FUNDS Fund Name Period Return Caldwell & Orkm:Agg Gro 12 Months Torray Fund 5 Years Oppenhmr QuestOppty; A Quarter 1 Return 11.10 Quarter Pillar. Equity lnc;A 8.06 50 36 12 Months PillarEquity lnc;A Franklin Cust:lnc;l 5 Years 35.42 123.02 10 Years Franklin Cust:lnc;l 21 1 .48 15 Years Vanguard Wettesley Inc 629.17 87 2 1 302 55 377.78 IDS Mgd Retjrement.A FranWin Premier Ret 15 Years 14.08 45.11 GX B x BALANCED FUNDS Fund Name Period 6.591.1 49 39.25 34.11 25.82 17 149 27 47 495 646 19 296 12 15 23 125 36 51 39 1.875.2 2,851.6 49.919.6 3.250.6 25.61 21.25 7.167.1 5.990.7 42 49 1,996.0 30.91 32.621.8 24.58 14,330.1 36 60.138.9 356 26 1.833.7 22,654 4 3,047 64.600.5 249 Return 37 73 125.37 10 49 30.34 -4 59 24.41 30 17 16.85 41 45 16.05 16.72 1 76 30.82 30.79 47.17 9 41 5.79 1.85 20 56 32.17 18 80 1 95 1 97 13 82 36 84 37.74 31 54 26.84 27 34 . 25.05 NA NA 245.70 NA NA Japanese Funds Latin American Funds Mid Cap Funds Natural Resources Funds Pacific Ex Japan Funds Pacific Region Funds Real Estate Funds 427.93 222.23 252 35 79 41 92.26 34.16 105.29 113.44 1 43 30 63 51 34 45 9.12 NA NA NA 469.22 209.42 505.26 283 04 992.71 294 50 NA NA S&P 500 Index Objective Funds Science 4 Technology Funds Small Company Growth Funds 656.16 547.64 475.83 267 59 148 88 51 42 100.39 67 79 85.91 110.09 379.59 23941 NA 572 30 271.46 280.71 178 61 550.48 245.72 161.33 142.39 77.26 110.40 NA NA 7197 NA 166 71 210 81 146.30 321 06 21 70 102 89 NA 820 53 657.57 218.19 44.20 235.95 586 80 562.95 232 79 251.83 477.75 231.28 57.10 158 20 112 31 NA 457.32 SpecialtyMiscellaneous Funds Utility Funds All Equity Funds Average 87 1,069,451.4 Return 543 50 596 68 QuartSf Return Return Capital Appreciation Funds Emerging Markets Funds Environmental Funds Equity Income Funds European Region Funds Financial Services Funds Global Funds Global Small Company Funds Gold Oriented Funds Growth & Income Funds Growth Funds HealthBiotechnology Funds International Funds International Small Co Funds Canadian Funds 88.386.2 3.931.3 50,890.9 8,593.7 5.177.0 256,507.5 289,057.2 6.187.6 79.589.5 2.659.7 Return Type of Fund 3 181 69 5 147 9.951 0 101.8 21.92 15.56 11.08 8.80 Number of Funds 56.822.5 30.39 7.93 6.21 61 .34 Return GMO Emerg Country Debt Quarter 12 Months GMO:Emerg Country Debt T Rowe Price IntBond 5 Years 10 Years MFS World Govts;A EQUITY FUNDS Total Net Assets (SMIns) 374 8 Quarter (SMillions) 46653.2 22528.1 16 82 Period PERFORMANCE BY FUND OBJECTIVE assets Fidelity Magellan Fund Investment co Of America Washington Mutual Inv Return Benham Target:2020 Quarter 12 Months Benham Target:2020 Dean Witter High Yield 5 Years 10 Years Benham Target:2C10 15 Years Kemper High YeW.A 10 Years WORLD INCOME FUNDS Fund Name W1 INCOME FUNDS Fund Name SEE AND OBJECTIVE PERFORMANCE OF BIGGEST FUNDS Total net Pehoo FX Fund Name Period (3)(S)d))(( FIXED Fl Return 137 57 320.57 2.46 2.15 3 39 0.02 5 69 0.10 5.14 1.26 0.15 4.01 4 53 2.36 11 62 1.93 0.26 4.00 4 87 1.75 4 32 0 54 1 22 3.87 5.84 6.30 1 68 2.32 6.88 2.46 BOND FUNDS 14 1.043.8 40 4,470.6 318.553.9 30.394.8 1,520 186 70 13.370.9 16.078.3 34 217 23.572.6 FUND PERFORMANCE FOR VARIOUS TIME PERIODS nTOP Total Return Total Return Invest. Obj. mrm I T Rowe Price Sci Tech Fl 16.82 G 18.22 CA 15.74 Merrill Technology;B TK 17.50 Sm Barney Spec Eqty;A Sm Barney1 Spec Eqty;B SG SG 15.53 Merrill Technology;C TK 17.43 15.31 Merrill Technology;D TK 17.36 Capstone Med Research Turner Small Cap Benham Target:201 5 Franklin StrGlbl Hlth H 14.81 Merrill Technology;A TK 17.33 Turner Small Cap Reserve Priv:Emer Growth Bruce Fund SG 14.47 Steadman Associated Fd El 16.67 Dominion:lnsight Fl 14.35 Astra:AdjRtl Fl 15.81 H 14.25 Astra:Adj Rt IV Fl GMOEmerg Country Debt Inaghtful Inv Growth Monitrend Growth Fund Wl 14.08 Fl G 14.08 Astra:Adj Rt AstraAd, Rt Fl 14.97 G 14.00 Robrtsn Steph:ValGro MC 14.65 Putnam Hlth Sciences;A H 12.70 TK 14.57 GT Global Hlth Care;A S H 12.59 Putnam Hlth Sciences;M H 12.53 Steinroe Capital Opp Putnam Hlth Sciences;B CA 12.50 H 12.49 GT Global Hlth Care;B H 12.40 Seligman Communidn;D Seligman Communictn;A Fidelity Set DvlpComm" US:Gold Shares EV Mrthn Greater India EV Trad Greater India Invesco Strat:Health H 12.18 H 18.97 H SunAmer:Gro & lnc;A Gl 11.84 SunAmer:Gro & lnc;B Gl 11.73 II Wright Equi:Mexico Chesapeake Growth Fund 12.11 Gl Fund y CA 63.38 62.30 25.05 & Hudson Investors Fund' Steadman Amer Industty 28.21 AU 26.83 Putnam New Oppty;A G G 28.21 CA G 22.21 AlgerCapital Apprec Perkins Opportunity Fund Fidelity Set Elctronic 6ovett:Smaller Co;A & Growth TK SG SG SG CA G ' t aVTOP Invest. Obj. FUNDS Fidelity Sel Health H FS FS 14.42-. Reg Bnk;B TK 13.96 Fidelity Set Home Fin AU 13.60, TK XJ 13.01 TK XJ LT, G G CA . NA 502.32 NA iKI Invest. Obj. BOTTOM FUNDS gold mines, coins or bullion. Total Return Seligman Communictn;A Fidelity Set Elctronic Twen Century:Giftrust 13.00 PBHG Growth Fund 12.99 J Hancock Spec Eq;A 12.55 12.40 ' AIM Eq:Aggress Gro J Hancock Reg Bnk;B 12.09 SG CA SG SG FS Astra:AdjRtl 37.21 appreciation, Ast'ra:Adj Rt Fl Astra:Adj Rt II EV Mrthn Greater India Fl EV Trad Greater India XJ Wright Equi:Mexk American Heritage Fund S LT XJ CA -- - CA Capital Appreciation: Aims nTOP Fidelity Magellan Fund S CGM Cap Development Return G 1.638.85 G 1,575.81 Fidelity Destiny G Sequoia Fund G 1,347.04 Oppenhmr Quest Value;A 1,168.46 CA 1,052.12 Mutual:Qualified Gl Merrill PC 992.71 Davis Ny Venture;A G Oppenheimer Target;A CA 981.19 971.49 Pacific;A LWi 1,033.34 . BOTTOM FUNDS Total Invest. Obj. Return G Steadman Investment Bull&Bear Gold Investors Steadman Associated Fd G. 85.43 78.06 53.57 47.36 45.96 30.56 AU 19.24 El Lexington Goldfund AU 32.03 54.15 Steadman Tech & Growth Steadman Amer Industry American Heritage Fund S Lexington Strat Invments AU US Gold Shares AU CA CA frequently portfolio turnover, 37.06 36.52 33.43 33.40 33.37 30.59 conserving principal hv balanced portfolio of bolh at Fl CA maximum capital ai by means of lOO'J or more purchasing unregistered options, etc. May lake large cash leveraging, securities, purchasing positions. El - Return EM 541.66 522.32 420.85 383.38 352.26 350.09 349.79 343.39 335.42 328.47 ' j LJ m--m I 1 Invest. Obj. TOP FUNDS Total Return BOTTOM FUNDS Invest. Obj. S Total Return Lexington Strat Silver Invesco StrafcGold AU 4.48 43.59 Monitrend Gold Fund AU 62,71 Steadman Tech & Growth Steadman Amer Industry US:GokJ Shares Centurion TAA Fund G 49.55 47.02 33.85 25.85 11.09 8.04 CA AU G EN Progressive:Environmnt Steadman Investment S Astra GI:Sh Equity Income: Seeks relatively high current Emerging Markets: Invests - at investing G Twen Century:Giftrust SG Seligman Communictn;A Invesco StraCHealth PBHG Growth Fund H 957.40 767.62 726.72 684.02 CA 671.11 TK G 664.80 Fidelity Sel Home Fin FS Invesco StratTech TK 572 63 545.88 542.45 Fidelity Destiny II Eq:Consteltn;Rtl A MC 6.W ol total G Wl -- 4.72 in Includes waste management, pollution control and By CHET CURRIER AP Business Writer If you asked 20 NEW YORK owners of stock mutual funds about their way of doing things, at least 19 would doubtless describe theminvestors. selves as After all, that's the long-terapproach most mutual funds are designed for, and that almost every investment adviser recommends. has the undeniable virtue of keeping you clear of the frenzy in the stock market, the waves of greed and fear that sooner or later overwhelm the traders. majority of short-terAs judged by the historical record, stocks are risky and volatile investments over any short period of ld m Buy-and-ho-ld day-to-d- m time, but become much more solid bets as your time horizon expands to five years, a decade or more. But even though many people have practiced it successfully, investing isn't as easy or as simple as it may appear. Just ld declaring yourself a patient, long-teroperator doesn't automatically make you one. Now. at the crest of a bull market, the case for investing in stocks looks simple and persuasive. But in the depths of a bear market, the likes of which Wall Street hasn't seen since the start of the 1990s, the arguments for avoiding or getting out of stocks can seem equally com- m ar pelling. Why else would so many people sell their investments at depressed prices? If people were as good at making commitments as they think or wish they were, points out Paul Merriman, a Seattle investment adviser, then close to half of all marriages wouldn't end up in divorce. "People have a certain threshold for pain," Merriman observes. "Once they exceed that limit, their behavior starts to change, sometimes in unpredictable ways." Dick Fabian, a Huntington Beach, Calif., fund adviser, notes that the very fund managers who urge their clientele to take a approach often don't follow that advice themselves, but constantly shuttle the stocks in their portfolios, Merriman and Fabian both ado- ld 4.36 Invest. Obj. Total Return 44 Wall Street Equity Steadman Tech & Growth Steadman Amer Industry American Heritage Fund S Steadman Investment US:Gcdd Shares Centurion TAA Fund Steadman Associated Fd Lexington Strat Invments CA G CA CA G AU G El 66.19 77.82 72.32 38.30 28.19 16.43 1325 7 56 AU 5 94 H - - European Region: Concentiatcs in Income: Seeks a high level of current income by I slocks, bonds and money investing in markets instruments. IF - Irrternational: Invests in securities whose primary JA - Japanese: Concentrates its investments in Japanese companies. Latin American: Concentrates MC Invests in companies MidCap: its investments trading markets equities whose primary are in Latin America. in or operations with market capi- talisations or revenues between $800 million and the average capitalization of Wilshire 451X1 index. - Natural Resources: in Inv ests more than 65 of its naUnal resources stocks. its investments in equities whose primary trading markets or operations are in Europe Fl - 651 of its equity health care, medicine invests HealthBiotechnology: equity commitment EU market instruments, nney portfolio m companies engaged and biotechnology NR Fixed Income: Invests more than 751 of assets Pacific Region: Concennates PC equities whose primary are in the Pac ific. its investments trading markets in or operations in fixed income issues such as money market instruments, bonds andor preterm! slocks S Specialty to a specific & Miscellaneous: Limits its investments industry such as transportation, retailing, paper Financial Service: Invests rV; of its portfolio companies providing financial services, such as banks, finance companies, insurance companies and FS - in Flexible Portfolio: Allivatcs investments across inc luding common stocks, bonds, and money market instruments, with the focus on total rrium Growth: Normally invests in companies whose lone. term earnings are expected to grow significantly fasie. dun the earnings of slivks in the major unman-ageslock indeves. Gl Growth I onentaiion andor GL Income: Combines a Science tor level Global: Invests at least 25? of us portfolio in traded outside portfolio ty in & Technology: Invests 65 of its equi- science and technology slocks. Utility: Invests 65 sharev UT of its equity portfolio in utility Wl - World income: Invests primarily in U.S. dollar and dollar debt instruments. Pacific XJ mary trading markets region, but not Japan. Invests in or operations equities whose priare in the Pacific FOOTNOTES: with an income requirement rising dividends. securities Small Company Growth: Limits its investments of sit. SG to companies on the basis TK brokerages various assets classes, BOTTOM FUNDS domestic stivks. bonds and relat- ed services. the L.S. and may own L.S. securities as well Global Flexible Portfolio: Allocates investments Source- investing 4.49 across various assets classes, including foreign and LT least Environmental: Invests at least 65"? of its portfocompanies whose business, in ihe fund's opinion, contributes to a cleaner and heallhier environment. lio GX Buy-and-ho- ld WIS or EN - G Guardian Park Avenue Fd AIM ifcal 4 32 2.47 3.53 3.88 3.02 trading matkets are outside Ihe U.S. income and income growth through more of its portfolio in equities. 10 YEARS 15 YEARS Total Aims Fl Gro FX Invest. Obj. Us equit portfolio in mining finance houses, gold 2.04 2.64 37.33 CA Dreyfus Cap Value;A 5 YEARS Total 4.23 with the locus on total return Balanced: B - 651 of maitaining al all limes a stocks and bonds. Progressive:Aggr Astra:Adj Rt IV 74 56 105.01 60.19 84.60 65 27 79 21 38 20 MUTUAL FUND DEFINITIONS AU - Gold: Has ai leasi assets in emerging market securities. " TK 325.59 321.96 78.57 70.35 69.40 68.99 68.16 67.46 64.77 64.60 CA 15.46 15.26 Return TK G -- Total Invest. Obj. TOP FUNDS Steadman Tech Growth US:Gold Shares Steadman Tech & Growth FrontierEquity Fund Reserve Priv:lnfrmd Inv SG Sm Barney Spec Eqty;A Dean Witter Health Sci Bruce Fund Dean Witter Health Sci Benham Target:2020 Montgomery:Seled 50 Global Flexible Port Funds Income Funds World Income Funds 12 MONTHS BOTTOM LVuel FUNDS .509.24 404.54 338.32 (equity and bond) QUARTER Invest. Obj. NA 25.16 22 56 20.81 15 22 25 08 17.35 21.66 15 67 8512 196.14 210.31 161.89 133 99 1 68.02 128.13 171.89 135.42 544.12 Balanced Funds Balanced Target Maturity Convertible Securities Funds Fixed Income Funds Flexible Portfolio Funds S - A significant event affected performance. - A representative sampling of the Lipper objecuve groups this summary. Performance and rankings are based on figures through and additional data received bv Lipper Analylica! as of 7 p m. 4.V These include Nasdaq and in - J?" stock and taxable bond funds. Lipper Analytical Services Inc and The Associated Press it's not as easy as it looks that involve cate approaches an attempts to time the market endeavor that can add extra layers of complication and uncertainty to the job of managing your money. Critics, in fact, contend that market-timin- g is an impossible mission, unless you count on good luck to bail you out. What choice does that leave you? Well, you can aim to be a ld investor who heeds the warnings about the perils of that particular pursuit. For starters, you can look at each fund you consider for possible purchase not just on its bull market record, but on its potential behavior in less rosy times. If it was operating under its present management and philosophy in the bear market year of 1990, how did it perform then ? How much did the net asset value fall between late August and late October 1987, w hen the stock market crashed? Punch the same sort of percentage decline into a calculator for the investment you hold now, and imagine how you might feel if that fate either in a befell your money sudden market drop or a more protracted decline, like the long bear markets of the late 1960s to mid-1970- s. Furthermore, you can try to set some standards in advance that you can use to evaluate whether you have simply picked the wrong fund. After all, even investors need to monitor their funds periodically to make sure they ld are at least keeping up reasonably well with their competition. Most of all, veterans of the game say, it is important to design a portfolio to stand up to all kinds of financial weather, not just the conditions that prevail right now. That usually means resisting the temptation to get caught up in the short-terperformance competition not just when you among funds are making your choices but afterwards, particularly when the markets are moving fast in either direction. One important step toward this end is to set investment goals that are determined by your own hopes and responsibilities, rather than by the changing moods of the financial world. ld m |