| OCR Text |
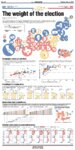
Show Page 10 SpecialFeatures 237 Electoral votes likely or leaning for Barack Obama Tuesday, Nov. 6, 2012 Electoral votes likely or leaning for Mitt Romney Tossup votes 191 The weight of the election 270 electoral votes needed to win BY CAROLYN ALER AND ALEX BORDENS N.H. Chicago Tribune 4 In the race for the White House, current projections put President Barack Obama slightly ahead of former Massachusetts Gov. Mitt Romney. Nine swing states, accounting for 110 electoral votes, will ultimately decide the winner. Though how each state will turn won't be decided until Tuesday, demographic similarities and history provide further speculation to how the race might unfold. Mass. 11 Key: ) — Circle area is equal to the number of electoral votes for each state a Likely/leaning Obama Tossup 0 Likely/leaning Romney Minn 10 Wis. 10 Alaska Wash. 3 12 N.C. 15 f Aillit--- cob * 1 la it ellabos -ON 1V1811" c Ariz. 11 1,,s 9 Texas 38 Fla. 29 Demographic trends and party lines Republican and Democratic states form two groups when plotted using education and income levels. Swing states fall in the middle. States likely to vote Democratic are among the richer and more educated states. Democratic states tend to be more than 75 percent urban. The swing states form two distinct groups when plotted by the percent of the population that is Hispanic. All figures as of 2009 All figures as of 2010 O /Mb Ohio BACHELOR 'S DEGREE OR HIGHER • LIVIN G IN AN URBAN AREA 50 40 30 20 10 $40:000 $30:000 $50,000 75 Wis. N.C 50 . Iowa N.H. 25 () MEDIAN HOUSEHOLD INCOME • Va. $70,000 $60,000 •• Nev. 100% 60% 10% 20% 40% 30% 50% PERCENT OF POPULATION THAT IS HISPANIC — v Unemployment in tossup states In September, states supporting Obama had a unemployment rate (8.4%) more than 1 percentage point higher than those backing Romney (7.1%). Seasonally adjusted MONTHLY UNEMPLOYMENT RATE Colorado Sept. Iowa Florida 15% —1 8.7% 10 10 10 • 0 if%‘'‘IC) 5 5 '09 '10 '11 '12 Nevada 15% 15%•••• Sept. 15 % • Sept. rhai1/4. New Hampshire 11.8% 10 5 '09 '10 '11 '12 U.S. (September rate: 7.8%) Swing state 15% 10 5 North Carolina ru, Virginia Ohio 15% 15%•••• Sept. Wisconsin 15% 15% 10 /0"hialho 10 9.6% 10 . 5 1° t—"\- 0 5 z) 5 5 5 Sept. Sept. Sept. Sept. Sept. 5.2% 5.7% 7.0% 5.9% 7.3% '09 '110 '11 '112 '09 '110 '11 '12 '09 '110 '11 '11 2 '09 '10 '11 '12 '09 '10 '1' 1 '12 '09 '10 '1'1 '12 '09 '10 '1'1 '12 NOTE: September unemployment figures for states are preliminary. Where states stand on health care The percent of swing states' residents who are without health insurance follows party lines more closely than the percent of residents who receive Medicaid. The majority of swing states have low percentages of people on Medicaid. Six of the nine swing states were plaintiffs in the Supreme Court case against the Affordable Care Act. PERCENT WITHOUT HEALTH INSURANCE In 2009 PERCENT WHO RECEIVE MEDICAID In 2009 PLANTIFFS IN SUPREME COURT CASE AGAINST THE AFFORDABLE CARE ACT 30% Plaintiffs highlighted Florida Nevada North Carolina Colorado Ohio Virginia Iowa - New Hampshire Wisconsin NOTE: Supreme Court ruled in favor of the Affordable Care Act. Historical voting trends in presidential elections WINNING CANDIDATE'S MARGIN OF VICTORY Colorado Percentage point difference Florida .20% . 20% Iowa 20°A 20% 0 Democrat Republican 0 = Winning candidate's party New Hampshire North Carolina 20% 20% • • 20% 20% Virginia 20% Wisconsin 20% 20% 1980 k NER 1984 • 1988 WINNE WIN WINN WINN• NER 2004 2008 WINN. O NER INNER INNER NER INNER - WINNE ,NNER WIN' • SOURCES: U.S. Census Bureau, http //uselectionatlas.org/, Bureau of Labor Statistics, Chicago Tribune 0 2012 MCT SWING STATES MCCLATCHY-TRIBUNE |