| OCR Text |
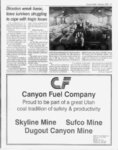
Show Coal shifts: News Source Castle CountryS' j r- jki. if, (Continued on page 42) iI O rtf " t We deliver, the "t3iv I.tm ft news and more... 5J iri iivcs tYour local newspaper is a very important part of your jU community. We take that responsibility very seriously in lfrVingto keep you informed about events, facts, and even :cta sales! We hope you have noticed the changes and infew months fill pffwe piers to the product during the past and we are striving to make the products even better. We hope you enjoy the Energy 2000 edition. Just an-oth- er tetfample of how... ts deliver for you! Sun fidvocatc We IVoir v 'vf''meni County r fi ? t' Christa Kaminski has been in the newspaper business for the past 30 years. Her layout end design skills have made many a happy customer. i Progress v At A i t. Right: Lynnette Lessar, Sue Mosher and Loretta Trejo review the finished Energy 2000 layouts for any additional suggestions prior to publishing. "S AAA a f . P) 'Vi ' 0 Left: Kevin Ashby works on the color separa- tions used in the . f r IlJT i, ' -i Energy 2000 edition. He has i . ' 1- AdLynnda Johnson has been the Sun She six for the past vocate editor years. is a Carbon County resident and enjoys writing about the present as well as the as it affects this areas lives. past V 4 county-owne- d lands pro- duced only 37,000 tons. For the first time in a de- cade, coal production from fee lands slipped below 2 million tons (1.735 million tons) in 1992. In 1993, fee lands production decreased by 50 percent to 826,000 tons, dropping further in 1994 to 415,000 tons or 1 .7 percent of total production. In 1995 fee land production moved up by 11 percent to 461,000 tons or 1.8 percent of total production. In 1996, fee lands came in at 614,000 tons or 2.3 percent of total production. In 1997, there was another increase to 928,000 tons or 3.5 percent of total production. During 1998, production from fee lands went up to 4.9 percent of the total production while, on a tonnage basis, production increased by more than 41 percent (from 928,000 to 1 .31 2 million tons) as com- pared to 1997. By contrast, coal produced from fee lands in 1983 represented almost 40 percent of v i- production, state lands have historically only accounted for between 1 percent to 5 percent, which increased to above 6 percent and 7 percent in 1992 and 1993. In 1994, state lands production fell back to 5 percent, dropping in 1995 to 2.3 percent. In 1996, coal production on state lands decreased to 1.6 percent and, in 1997, declined to 1.3 percent. During 1998, state land production at 1.1 percent registered at the lowest percentage point level in more than two decades in Utah. Production from county lands has always been minimal and erratic. During 1998, i been the Sun Advocate and Emery County A Progress publisher for the past six years. total production. During 1998, seven operating longwall panels in Utah accounted for 75 percent of the state's coal production or 20.01 million tons. The figure amounted to an average of more than 2.86 million tons of coal production per longwall panel per year. Twenty-fou- r continuous miners in Utah produced a total of 6.595 million tons of coal for an average of 274,790 tons per machine per year. In recent years, however, some machines have produced between 400,000 to nearly 600,000 tons per year. |