| OCR Text |
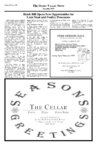
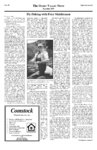
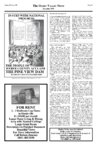
Show Volume II , Issue III Page 21 The OGDEN VALLEY NEWS December 1999 IN STEP WITH NATIONAL PROGRESS THE PEOPLE OF WEBER COUNTY ACCLAIM THE PINE VIEW DAM BOARD OF COUNTY COMMISIONERS Ad from the Standard Examiner dated September 28, 1934. 249 North 9000 East FOR RENT 2 - 3 Bedroom Log Home in Huntsville $1,100.00 per month Large Open Living & Dining Area with Vaulted Ceilings Large Great Room Downstairs in Finished Basement Beautiful Views For More Information Call Ruben Jimenez (801) 485-1058 Pineview cont. from page 20 consequently enlarged from 61 feet in height to 132 feet, with an expanded carrying capacity of 110,200 acrefeet–or 36 billion gallons—from the previous 44,200 acre-feet capacity. The length of the dam went from 500 to 600 feet in length, and the spillway was rebuilt to conform to the enlarged dam. The job also included the construction of the Eden and Huntsville highway that encircles the reservoir. Enlargements were completed in 1957. A Standard Examiner article states, “As part of the original contract, a 75inch wood-stave pipeline was installed from the dam to the mouth of the canyon . . . Two concrete-lined canals were built, each beginning at the canyon mouth. One went north . . . to Brigham City, and the other south along the mountainside east of Ogden, about 6.5 miles to the old Ogden Municipal Airport. The wood-stave water line fed power generating turbines at Utah Power’s Pioneer Station, at Harrison and Canyon Road, then moved down the river’s natural channel to water farmlands in western Weber County. By 1983, the project delivered irrigation water to 12,731 acres of grain, hay and pastureland, vegetable and fruit operations and family gardens that harvested produce valued at $9,440,993, a per-acre value of $1,200. Legacy cont. from page 19 alternate routes and the roads surrounding the bridge. This is because, like most models, the analysis assumed a relatively constant demand for vehicle travel. What occurred was actually very different. It turns out that congestion levels have not increased appreciably, and 21% of the people who formerly drove across the bridge are now using other modes. On land use, the issues are really three: location, mixture, and design. On location, the question is Where are you placing your higher intensity land uses? We know that higher intensity uses are capable of generating a significantly higher number of transit riders, bicyclists, and walkers than low intensity uses. Measured on either an acreage or a transit service hour basis, there are just more people who, under the right circumstances, will choose to access an office tower or a department store without a car than people who will access a halfacre subdivision or a warehouse sans auto. So, if you assume that the market will provide only so many higher intensity—and therefore transit supportive—uses, the careful placement of those uses as they are developed will play a crucial role in the degree to which people choose to drive or choose to use some other mode. If the higher intensity uses are spread out across the landscape, their potential to reduce automobile driving will be squandered. If, on the other hand, those uses are carefully placed in centers and corridors that are well-served by transit, transit ridership, bicycling and walking can all be increased and future traffic congestion headaches can be mitigated or avoided. The Dutch have institutionalized this relationship in a policy called “The Right Business in the Right Place,” or better known as the “ABC Policy.” Under this policy, regional and local governments categorize lands within their jurisdiction according to the degree of accessibility to both transit and highway systems, and then match new businesses to those locations according to the degree to which the businesses are either transitsupportive or highway-dependent. Legacy cont. on page 22 This observation has been quantified in a number of places, including a case study of a new bypass built around Barnstaple, England, a medium-sized town in Devon County. The study observed daily traffic volumes on pre-existing roadways for periods that both pre-dated and postdated the bypass construction. The data show that the traffic volumes on the pre-existing roadways did not slack off after the opening of the bypass. They generally continued their normal increases of 2-5% a year, regardless of the bypass. So instead of relieving traffic from the pre-existing facilities, the bypass just added to the total traffic volume for the Barnstaple area by about 11,000 vehicles a day, just within the first two years of its opening. Going beyond the case study approach, a recent study of road capacity in a wide range of California communities demonstrates that for every additional lane mile of highway constructed, there is a 1% increase in metropolitan-wide vehicle miles traveled within four years of the construction. Even in the smaller communities, such as Stockton, this increase was shown to be as much as 8,000 additional miles traveled each day. If adding capacity to the highway system does not solve the congestion problem, what then can we do? The answer has to lie with reducing demand. Although there are many approaches to transportation demand reduction, I want to highlight just two: capacity reduction and land use planning and design. Capacity reduction, you say. How does reducing capacity on the highway system lead to anything else but more traffic jams? A review of 60 road closures conducted for the U.K. Department of Environment, Transport, and the Regions shows that reducing highway capacity can result in a 20 to 60 percent decrease in traffic volume. One of the cases studied was the permanent closure of London’s Hammersmith Bridge, which before 1997 carried 30,000 vehicles per day. Transportation models predicted the closure would lead to mayhem for Ogden Valley may be isolated in the event of a disaster. Your Local C.E.R.T Organization is in need of volunteers and donations. Please call Linda Spencer at 745-0805 or 399-8640 |