| OCR Text |
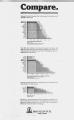
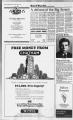
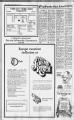
Show Compare the price Mountain Fuel customers pay for natural gas with that paid in other cities: ' Oklahoma City Salt Lake City Butte Chicago Las Vegas Albuquerque Great Falls Phoenix Houston Denver Cheyenne Milwaukee Seattle Reno Portland Boise New York 3 514.82 537.44 3 585.28 w J -71 o nc SI COC 1 I 716.24 ----- - 810.04 ZD 825.79 ViViYiYmVin .WATyAWWV." j'lMIHl'lllllll W.VJH D 827.86 Z3 854.98 Z 856.76 945.36 956.02 I'JWA'.'AJAWMi! ,;rzm 1,015.75 11,091.46 0 200 I 400 600 800 1 ,000 1 .200 Annual Residential Gas Bill (Dollars) 4th Quarter, 1982 Based on Rates in Effect in Cities Shown Applied to Usage of Typical Customer on MFS System ( 1 400 Therms) Yes, Utah rates continue to be among the lowest in the nation. But does the typical Utah family pay a larger percentage of its income for natural gas because salaries are lower here? The following chart indicates indi-cates that this is not the case: Phoenix Las Vegas Houston Oklahoma City take City 1 Chicago Albuquerque . Cheyenne Portland Seattle Denver C?; -Milwaukee Butte New York Great Falls Boise 1 m 2.o 3 2.0 2.0 2 3 2.7 2.8 r f 33 'iwSivYSSffiSj 3.5 ?,'.w.i.;.w.-AW.q o c. fhi'iWfiYiiViViiTiViil J.yJ 3 4.0 3 4.1 MAW.5,jy.; 3 4 5 6 Annual natural gas bill percent of median family income 3rd Quarter, 1982 (most recent comparisons available) Source: 1980 Census Has warmer climate than Salt Lake City's Not only are rates lower here, but compare the cost of natural gas with other energies for residential use: Coal Natural Gas 2 Fuel Oil Propane Firewood Electricity 1 0.325 t r iQ a WVWWWAW.W.W.V.V.W.V, 0.733 WWMMA'.WJ.M.M.U 10.891 tjj-.AX1.ju...1f..ft..i..u.... .... ... . .. .-.-.-.-.-.-.Yfr, n 3 1.034 0.0 0.2 0.4 0.6 0.8 1.0 1.2 1.4 Dollars Per Therm 4th Quarter, 1982 We think our customers need the facts to judge for themselves how we are performing. The bottom line of our performance: the rates you pay and the quality service you receive. That's why the shareholders of Mountain Fuel have paid for this message. MOUNTAIN FUEL Supply Company Si |