| OCR Text |
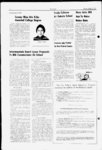
Show -4- - Thursday, February 27, 197S Thi Ufa Bwflotia Census Notes Changes In Indian Life D.C. (AIPA) WASHINGTON. - A CharStudy of Selected acteristics of Ethnic Minorities Based on the 1970 Census, Volume III: American Indians" has recently been completed by Urban Associates, Inc., and released Jan. 21 by the Department of Health, Education and Welfare (HEW), the study's contractor. According to a communique from Dr. George Blue Spruce, Director, Office of Native American Programs (ONAP), HEW, The report includes analyses of Census data and presents the Indian data on a comparative scale with that of the general population of the country. It also indentifies numerous problem areas resulting from the Census Bureau data from methodology, conflicting different sources, definitions which are used and other significant factors affecting Indian poeple. Socio-Econom- ic Highlights The following findings are included in the study under the heading, "Highlights: There are 827,000 American Indians and Alaskan Natives in the United States, who represent 0.4 of the total population. American Indians are to be found throughout the United States; however, nearly (508,000) live in just eight states. In descending order, by number of Indians, these are: Oklahoma. Arizona, California, New Mexico, Alaska (including Eskimos and Aleuts), North Carolina, South Dakota and Washington. While in 1930 only 10 of the Indians lived in urban areas, by 1970 45 of all Indians lived in urban areas. In the decade between 1960 and 1970, the urban Indian population more than doubled. Despite this increase, Indians remain the most rural group in the U.S. population. two-thir- Increased Mobility "An analysis of the migration patterns of the Indian population indicates that they are moving to places further away than merely the border towns near their reservations. More than, (221 of all Indians in 1970 lived in states other than those in which they were born. This trend in increased mobility of the Indian population is likely to continue during the next decade. one-fift- h Population Increase Noted Indians had the largest percent population increase of any group in the U.S. in the past decade, although their birth rate has started to decrease in the last few years, half of the rural of the urban population and 40 population are under 18 years of age. Although only 6 of the Indians are 65 years old or over, the proportion represents a measurable improvement of the Indian since 1960 when only 5 populatin was elderly. More Women Than Men There has been a gradual shift of the Indian Population from one that is predominantly male to one that is predominantly female. For the first time, in the 1970 Census, there were more Indian than Indian men. The higher proportion of men to women continues to exist among the elderly rural Indians. of all rural Indians over 65 Only 48 of age are women. years women Increased Inter Marriage of all Indians this to extent, the marry Indians have departed radically from the practice in most of the country where there is little racialethnic intermarriage. This high level of Indian intermarriage occurs most frequently amoung the urban Indians; 51 of all married urban Indian men and 55 of all married urban Indian spouse. Only women have a 20 of rural Indian men and 23 of rural More than non-Indian- one-thir- d s; non-India- n women have married persons other than Indians. of all births Barely three-fifth- s registered as Indian show both parents as Indian Indians. Almost of all Indian children under are not living with both their parents. This situation is more often the result of husbands being absent from home earning a living, than due to divorce or separation. Indians have among the largest families of all groups. However, there is a marked difference between the size of urban and rural families. Fifty percent of Shoshone Bannock Tribal Chairman Jimmy Dann, center all rural Indian families have five or more SEMINAR from throughout Utah attending an Adult Education addresses educators persons; only 32 or all urban families conference Ute the at Learning Center earlier this month. The purpose of the are that large, Rural Indians continue the to was aquaint educational personnel from other tribes and school meeting practice of extended families, representdistricts the with Tribe's Adult Basie Education Program. Business Committee ing a commitment to Indian ways and DuShane, provided an overview and background Elwyn culture. representative information on the Tribes program, and Chairman Lester Chapoose addressed the Better Education Achieved group at the luncheon at Bottle Hollow. one-thir- d 18 - The low educational level of American Indians is changing. This is particularly true of urban Indians, 26 of whom have had only 8 years or less education, equal to the level in the total U.S. population. In 1960, 28 of urban Indians were high school graduates; but by 1970, the On the percentage had risen to other hand, 48 of rural Indians have not gone beyond elementary school, and only 23 have graduated from high school. Despite the differences between urban and rural Indians in schooling completed, the rate of enrollment of Indians years of age is as high in rural areas, as in urban area, While the proportion of both urban and rural Indians with a college education has increased between 1960 and 1970, their rates of college attendance are still very low. 42. 14-1- 7 86. 87, Job Opportunities Greater In Cities Employment opportunities are greater for Indians in urban areas than in rural areas. The labor force participation rates of urban Indian men (72) and women (42) are virtually at the national level & (77 41) respectively. Urban Indian women are moving into the labor force at the same rate as the women in the general population. This is a major factor in bringing about an improvement in economic status of urban Indians. Thirty-on- e percent of the employed rural Indian men are employed as farm managers and laborers, both farm and The proportion is 3 times the national average. The proportions of r d skilled and workers among rural Indian men are close to U.S. averages. However, this data on the occupations obscure the impact of low labor participation rate and high unemployment rate among rural Indian males. Over half of the rural Indian men 16 years old and over are not working at all. non-far- blue-colla- semi-skille- percent of rural Indian Thirty-fiv- e women are employed in service occupa- are employed as operatives. These propord and tions in jobs are more than 50 higher than the national averages for women in the United States. The labor force participation rate of rural Indians (men, 56; and women, that of any other 29) isinfarourlower thanThe rate for rural society. group Indian males has changed little in the past decade. the unemployment rate of At rural male Indians is 3.6 times higher than the national rate. are Of all urban Indians, 10 2 times more than higher unemployed, than the rate for ' the total U.S. population. The unemployment rate for Indian women in rural areas is lower than the unemployment rate for Indian men, a situation that does not exist for any other group in the population. Continued on Page 6 tions and 22 semi-skille- d semi-skille- 14, low-skill- ed Cutbacks, National Energy Problems To Affect Reservations WASHINGTON. D.C. (AIPA) - Presi- dent Ford, in his State of the Union speech, presented to Congress last month in Washington, admitted that "the state of the union is not good, and outlined five major program goals to improve the sagging economy and to cut government spending. The proposed changes range from slowing down government wage increases t.o placing greater tariffs on imported oil. Most of the measures will not greatly affect Indians, but, in two major areas, proposed policy changes could have a great impact on tribes. The first major area involves cuts in government spending. Noting that the federal deficit for 1975 is expected to be $30 billion and the deficit for 1976 will top $45 billion. President Ford called for a curtailment of increased funding for ongoing programs and opposed the initiation of any new programs. To enforce this measure, President Ford vowed to veto any new spending programs passed by Congress. A cut in the federal budget would reduce expected increases in programs funded to tribes and would doom upcoming Indian legislation. Among those bills affected would be Sen. Jacksons Indian Health Care Improvement Act and the Trust Council Authority, Both of which call for significant budgets. A second area of import to tribes is Fords energy program. President Ford called for a significant reduction of foreign oil consumption to aid the economy and to get Project Independence, a program to make the United States in energy, off the His immediate ground. goal is to reduce gasoline consumption by one million barrels a day in 1975 and by two million barrels a day by the end of 1977. To encourage domestic production, Ford plans to open up military oil reserve fields in California and Alaska as well as encouraging greater use of coal and nuclear fuels. Coal production, one of the more controversial items in President Ford's energy policy, will be spurred by proposed amendments to the Clean Air self-sufficie- nt Act to allow greater burning of coal in power plants and by amendments to the vetoed Strip Mining Bill. Specific amendments to the Strip Mining Bill were not announced. These amendments would affect on going strip mining operations on the Navajo Reservation as well as proposed projects on the Crow and Northern Cheyenne reservations. Also affected would be exploratory lesses on Fort Peck, Fort Berthold, Uintah and Ouray, Standing Rock, Jicarilla and Ute Mountains reservations. The Four Corners complex of power plants would be affected by changes in the Clean Air Act. The major remaining sources of coal and oil are located primarily in the Rocky Mountain states, Alaska and on Indian reservations. Pressed by millions of energy hungry Americans, the federal government will be increasingly inclined to shelve environmental safeguards in favor of quick and ruthless exploitation of these reserves. The Rocky Mountain states have responded to this growing threat by forming an interstate alliance to develop joint environmental standards and to lobby against federal programs. The recent election of environmentally minded governors in New Mexico, Colorado and Wyoming has strengthened environmental interests in those states. The policy of those states is to advocate gradual exploitation of coal and oil shale reserves accompanied by stringent conservation guidelines. Indian tribes have only begun to develop their own guidelines for energy development, Whether or not Congress supports President Fords energy policy, tribes can expect to see greater pressure placed on them by energy companies to allow oil, coal and gas leases without environmental restrictions. If Congress supports President Ford, Indian tribes may find themselves in the middle of a battle between Rockly Mountain states, Conservation groups, the federal government and energy companies. The stakes will be billions of multi-nation- al n dollars and the be fighting in earnest. non-India- interests will Cooks Comer An inexpensive way to make a tasty drink cold-weath- er Mix for Chocolate Drink 6 cups Instant Nonfat Milk 8 oz. Pream 1 pound can Instant Hersheys Chocolate Store mixture in clean jar or can with a tight cover. ix in 1 cup hot water makes a delicious hot drink. By Nellie Johnson One-quart- er (Vi ) cup of |